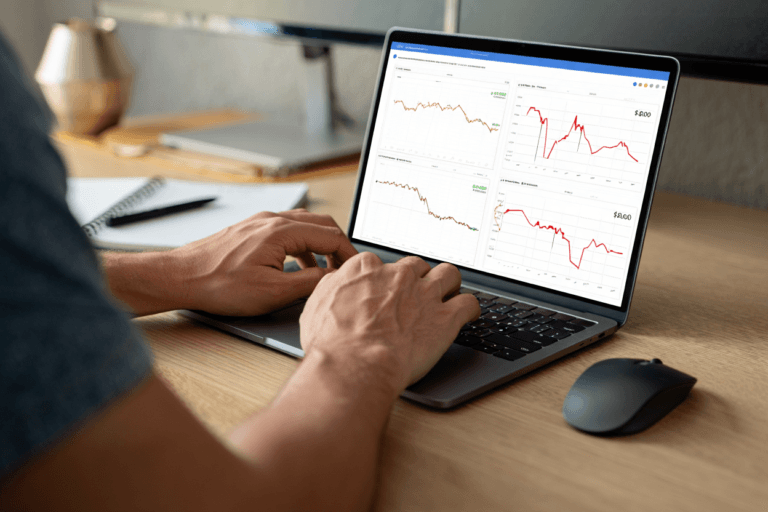

Power BI is enough when your team needs to report on data. A custom operational dashboard is the better choice when people need to act on live data inside their workflow: reviewing, approving and actioning the next step. If your staff export to Excel to complete the task, you have likely outgrown a reporting-only tool.
Reporting dashboards vs operational dashboards
Both are called dashboards. They are built for different purposes.
Reporting dashboard vs operational dashboard
Both are called dashboards. They are built for different purposes.
A reporting dashboard explains what happened. It is built for analysts, finance and leadership, refreshes on a schedule (daily or less often), and lets you filter, segment and drill down.
An operational dashboard measures what is happening. It is built for schedulers, coordinators, floor and service teams, runs live or near-real-time, and lets you review, approve, assign and action the next step. It has done its job if something happens in the next ten minutes.
People use two terms interchangeably. They are not the same thing.
A BI dashboard is the reporting layer. It pulls from a warehouse or a clean set of sources and presents governed metrics for analysis. Power BI, Tableau and DataStudio all live in this space.
A KPI dashboard is any screen that tracks your key measures against targets. It can be either of the above. The question that matters is not whether it shows KPIs, it is whether anyone can act on them without leaving the dashboard.
As our business operation dashboards page explains: an executive dashboard answers whether the business is on track, and an operations dashboard answers what needs attention today.
When Power BI is the right answer
We build custom software, but there are practical reasons for using a tool like Power BI.
Use Power BI when:
- Your data lives in one or two clean sources
- The audience is analysts or leadership
- A daily refresh is fast enough
- Users don’t need to update data or trigger workflows
If that describes you, a custom build is a waste of capital. Power BI will deliver the same outcome faster and at lower cost. Basically, if your only goal is accurate reporting from multiple sources, Power BI is able to do that job well.
Signs you have outgrown reporting-only tools
Staff export to Excel to complete the task. The dashboard tells them the order is late. The spreadsheet is where they determine the response, and every one of those spreadsheets is a decision your systems don’t have access to.
Your data comes from systems that do not share a clean model. An ERP, a CRM, a job management platform, spreadsheets and a third-party API, none of which agree on what a customer or a job is. SteelChief had this issue: trip planning depended on order data, delivery notes written in plain English, and live traffic conditions, which is three incompatible input formats before anyone opens a screen.
Different roles need different views and permissions. A scheduler, a depot manager and a finance lead need the same underlying data in three different ways, with three different permission sets. Enforce that with report-level filters and you are managing permissions in a tool that was never built to enforce them.
You need to edit data, give approvals or trigger workflows. The platform has to accept a decision, not just display source data. For SteelChief this was a core requirement: schedulers review each proposed trip, re-run it for late orders, and approve before any job is scheduled.
Near-real-time data matters. Requirements change in-between updates to data. SteelChief’s Trip Optimiser reassesses confirmed trips against live traffic, which only works if the platform is receiving close to real-time information.
Per-user licensing climbs as you roll it out to your teams. Reporting licences are priced for a reporting audience. Provide access to every operator and the cost profile can quickly scale in the wrong direction.
You want AI suggestions or responses inside the dashboard. Not a separate chatbot alongside the system. SteelChief’s natural language layer reads delivery notes and turns them into constraint rules, so the manager is not having to re-read every note manually.
What a custom operational dashboard is
It is part of a web application, built on your own data pipelines rather than layered onto a reporting tool. The dashboard and the logic behind it are the same system.
SteelChief is one example. We extended their existing Visit Management System with a Trip Proposer that builds delivery trips from the nightly order sync, and a Trip Optimiser that reassesses confirmed trips against live traffic, replacing a planning task that consumes four to six hours a day. Schedulers review each proposal, re-run it when an order arrives late, and approve before anything is scheduled (the full case study covers the build).
Dashboard or platform?
They are two parts of the same solution.
A business operation dashboard is the screen your team works in: live data from several systems, shown by role, with the actions that need doing. A business automation platform is the engine behind it: the AI, workflow automation and system logic that provide the processing capabilities and trigger the next step.
Dashboard vs Platform
A dashboard is the view layer. It answers: what does my team need to see and do?
A platform is the operating layer. It answers: which process should run itself, with a human signing off?
If your problem is visibility and action, start with the dashboard. If your problem is a manual process consuming senior time, start with the platform. SteelChief needed both, which is why the VMS has a planning engine and a scheduler review workflow.
Hiring a Power BI consultant vs a build partner
The two roles solve different problems, and hiring the wrong one is expensive.
A Power BI consultant fits when the reporting layer is the problem. Your data model is wrong, your measures disagree, your data refresh rate is slow, or nobody trusts the numbers. That is specialist work and a good consultant will fix it faster than a development team.
A development partner is the right answer when the workflow is the problem. The reporting is sound. What is missing is the ability to action anything without opening four other systems and doing a manual reconciliation. SteelChief is a good example: a better report would not have saved anyone four hours a day.
It’s not usually a question of “or”. We often build a custom operational layer for high-frequency workflows, with Power BI kept for leadership reporting. Each performs the function it was designed for, and neither is asked to be a substitute for the other.
If manual processes are the biggest blocker, that is a business automation platform question.
How we approach it
We start with a Discovery Workshop. It establishes which process is costing you, where the data lives, and whether the answer is a dashboard, a platform or neither. The deliverable is a working dashboard or custom tool as the first win, not a strategy document.
We also run new systems in parallel with existing systems until the team is able to trust the new way of doing things. SteelChief’s schedulers kept planning by hand while the Trip Proposer ran alongside, and the handover happened once the team was ready for it. We’ve found that this approach minimises disruption and speeds up onboarding, as there’s no steep learning curve, or chaotic change-over date.
Where AI sits inside the workflow, we scope it as AI agent development rather than a feature attached to a dashboard.
Decide before you spend
The question worth answering before you commit to Power BI reporting or a custom dashboard: Is it a snapshot of the business, or is it where the business operates?
A Discovery Workshop helps us to map your processes, identify where time is being consumed, and identify the solution that better meets your brief.